Recency bias or real service degradation?
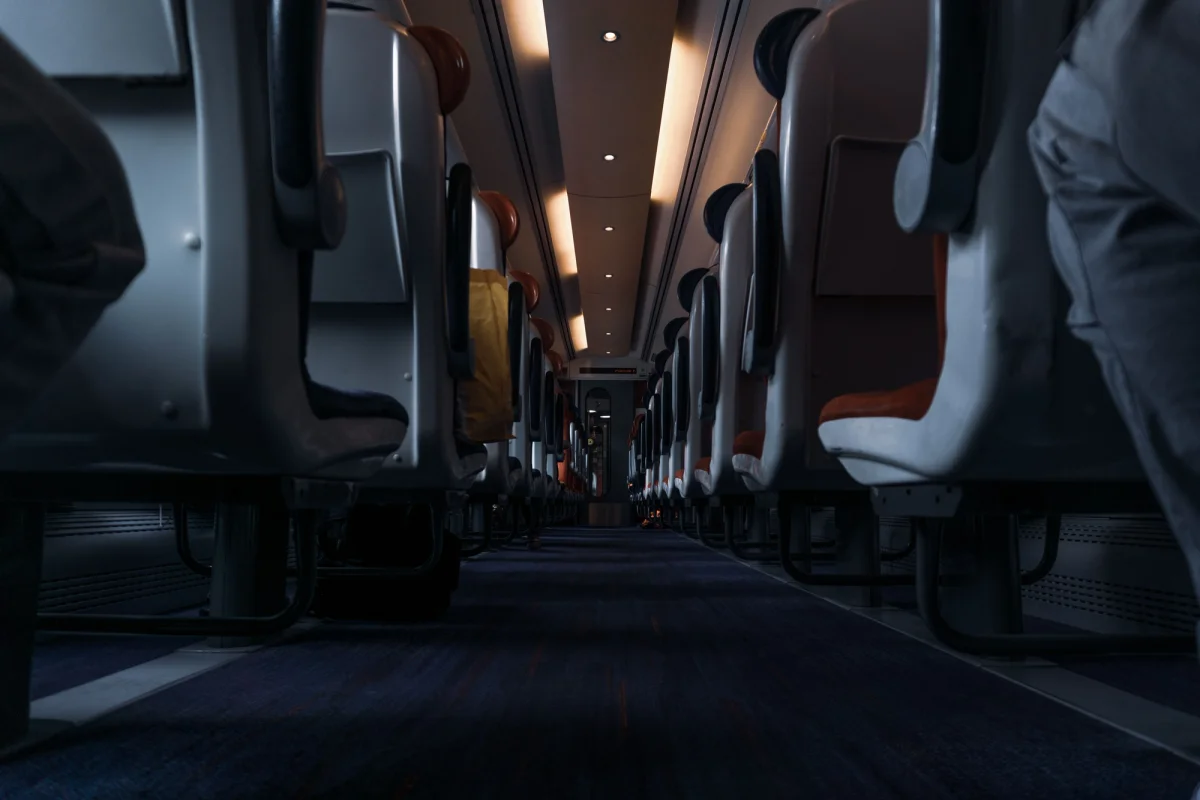

In December 2025, my VIA Rail train from Montreal to Quebec City stalled between Drummondville and Charny when the locomotive's battery died. Passengers sat there for about four hours with no heat, wrapped in aluminum emergency blankets. I got home around 3:30 a.m. A month later, I had to go back to Montreal for work, and my first instinct was to rent a car.
Instead of following that instinct, I took my own advice as an AI consultant: start from the data, not from the impression an incident leaves behind, to avoid recency bias. It's the tendency that makes us overweight recent events and forget the past.
The surprise: the December breakdown wasn't a fluke. My own travel history and VIA Rail's published data told the same story. The train had become less reliable. It's the same question we ask about an AI model in production: is this an isolated error, or has the world changed?
AT A GLANCE
Question · Is one memorable incident enough to conclude that a service has gotten worse, and how do you decide whether to take the train again?
Approach · Analysis of my 30 Quebec City–Montreal trips (November 2023 to December 2025), compared against VIA Rail's published on-time performance, followed by the design of a delay prediction system.
Result· All 3 serious delays fall within the last 7 trips. That's an unlikely pattern if the risk had stayed constant (about 1%), and it's consistent with the drop in on-time performance VIA Rail has published.
Limitation · 30 personal trips, so one traveler and one route. Only delays that earned a full refund are counted
The starting point: thirty trips and three serious delays
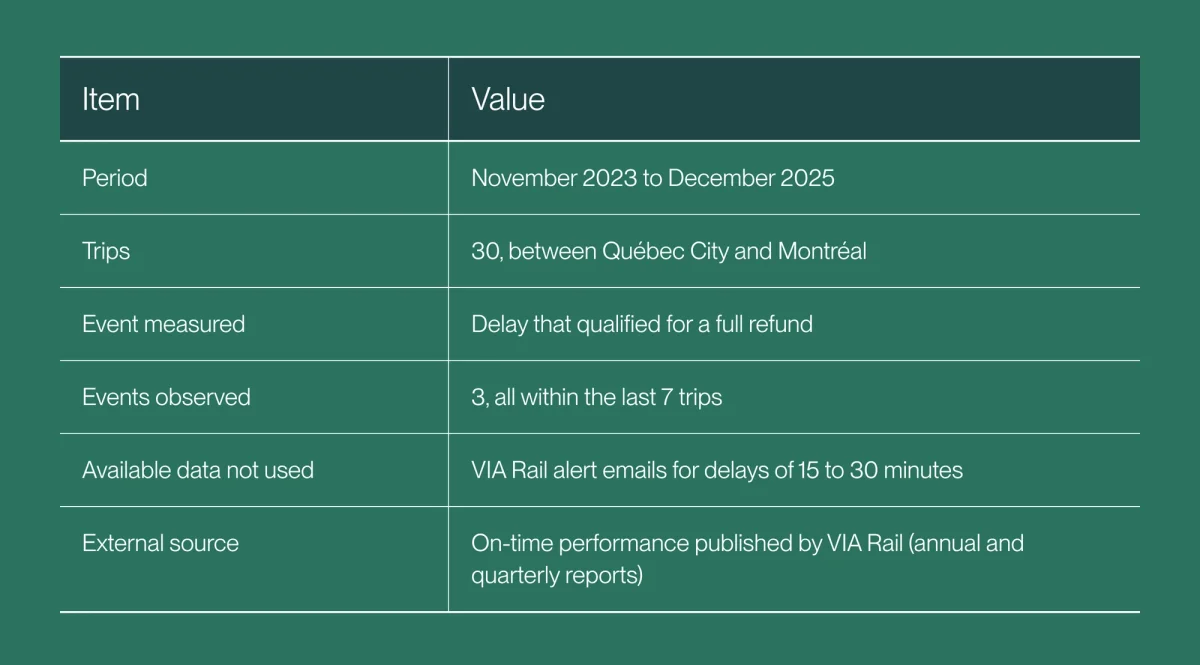
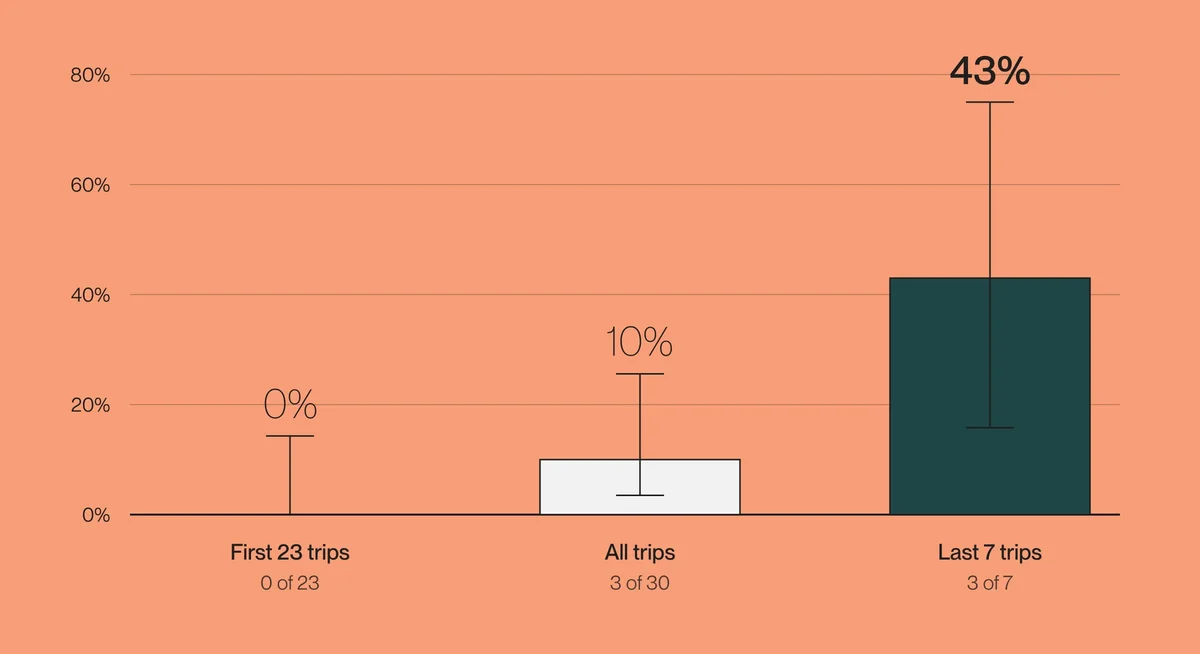
Between November 2023 and December 2025, I took 30 train trips between Quebec City and Montreal. Three of them ended in a full refund because of a major delay, for an overall rate of 10%. The timing is very uneven, though: the first 23 trips had no refunded delays at all, while all three refunds fall within the last 7.
Table 1. Starting conditions of the analysis
Two readings of these numbers compete, and each can lean on part of the data. The first, driven by recent experience, notes that nearly one recent trip in two went wrong and concludes it's time to give up on the train. The second, based on the full history, points out that 27 of 30 trips went fine and that one dramatic incident shouldn't erase two years of solid results. Neither, however, answers the question that matters for the decision: has the risk actually changed?
Telling noise, recency bias, and regime change apart
In statistics and in machine learning, a series of observations can vary for very different reasons.
- Noise refers to random fluctuations around a stable level. With a constant 10% risk, two bad trips close together followed by a long incident-free stretch are nothing unusual.
- Recency bias means giving too much weight to the most recent or most striking observations, which often leads us to mistake noise for real change. A dramatic incident is the classic trigger.
- A regime change, by contrast, means the level itself has shifted because a new cause is acting on the system. In a production model, we talk about data drift when the input data changes distribution, and concept drift when the relationship between that data and the outcome evolves.
CONCEPT · TESTING THE CONSTANT RISK HYPOTHESIS
If the risk of a serious delay hadn't changed, every trip would have had the same chance of a major delay, and the three incidents could have landed anywhere among the 30 trips. Yet out of 4,060 possible ways to spread them out, only 35 put all three in the last 7 trips. That's about a 0.9% chance of it happening by luck alone.
There's a classic catch in this calculation, though: the window of "the last 7 trips" was chosen after seeing the data. The probability that three incidents fall within some window of 7 consecutive trips is about 9%, which is low but not extraordinary.
The recent window isn't arbitrary, however. It's exactly the period that tells us about today's risk, and Figure 1 shows how big the gap between the two periods is. With so few observations, the confidence intervals stay wide: the rate for the last 7 trips falls somewhere between 16% and 75%, and the rate for the first 23 between 0% and 14%. The two intervals don't overlap, which strengthens the case for a change without being enough to prove it
Figure 1. Share of trips with a refunded delay, by period, with 95% confidence intervals
What VIA Rail’s public data adds to the diagnosis
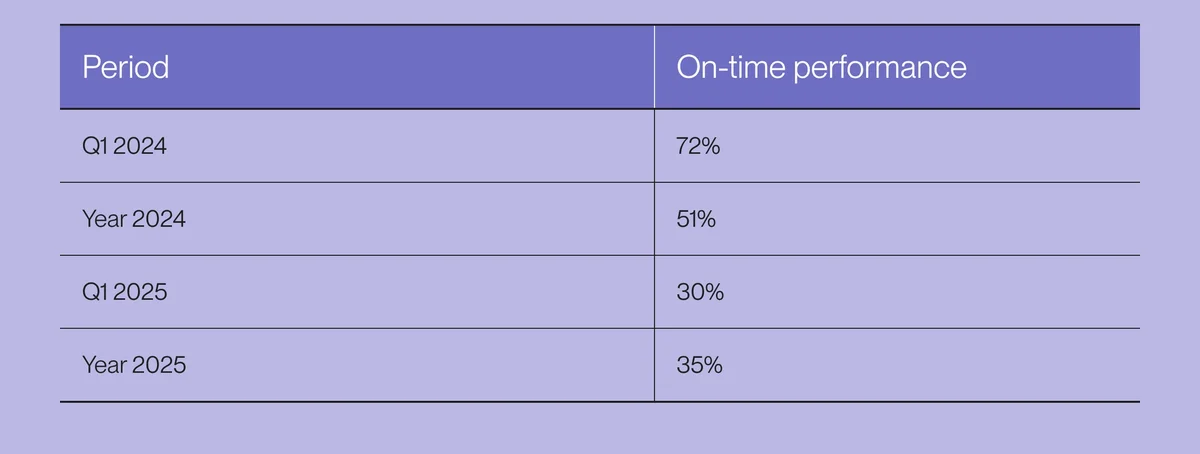
A small sample becomes far more telling when you test it against an independent source. According to its 2025 annual report, VIA Rail's on-time performance was 35% in 2025, down from 51% in 2024. Its Q1 2025 report had already shown a drop from 72% to 30% compared with the same quarter of 2024. The company attributes the decline to restrictions imposed by the track owner, mechanical problems, and the transition to its new fleet.
Table 2. VIA Rail's published on-time performance, all corridors combined
The structural context explains why VIA Rail has so little control over these factors. It owns less than 3% of the track it runs on, the rest belonging mostly to CN, and it has no priority right-ofway over freight trains, a situation it is asking the federal government to fix. In October 2024, CN extended to the Montreal–Windsor corridor a rule that already required the new Venture trains to slow down at level crossings between Montreal and Quebec City. VIA says this adds about 30 minutes per train on average.
Side by side, the two sources line up: the cluster of incidents in my recent trips coincides with a documented decline in service across the network. The full history acts as a baseline, the reference against which a recent change becomes measurable, whereas an overall rate calculated across the whole period would have hidden it. That said, this convergence is still a correlation. The available data doesn't let us attribute the three incidents I experienced to the causes VIA Rail cites for the network as a whole, especially since the December breakdown was a mechanical failure rather than a speed restriction.
Their decision : estimate the risk and reduce the impact
A higher risk doesn't automatically mean giving up on the train, because a decision depends on both the likelihood of an incident and its cost. In December, the cost came mostly from the conditions of the wait: the cold, no revised schedule, and a middle-of-the-night arrival home.
“So I took the train again a month later, working on the impact rather than the probability.”
My bag held warm clothes, as if I were heading out for a ski day, plus good boots, mittens, and wool socks. It's basically the kit you keep in your car in winter in Quebec and the Maritimes. The train arrived on time, which says nothing about the level of risk: a single good outcome weighs no more than a single bad one
From reactive tracking to delay prediction
The exercise highlights an asymmetry. VIA Rail already produces much of the data needed to anticipate its delays, but doesn't use it predictively. Its real-time tracker shows the train's position and speed, along with scheduled and actual arrival times at each station, and passengers get an email for every delay, along the lines of “Train 28 has been delayed due to rail congestion.” But this information only arrives once the train has left, when it's too late to change your plans.
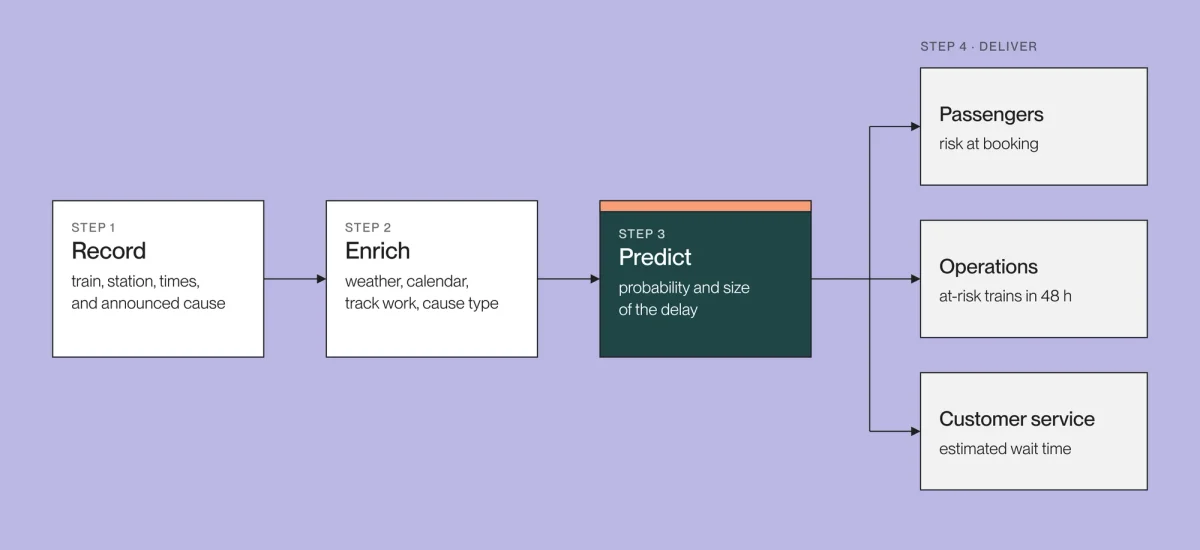
If VIA Rail entrusted us with this analysis, we would start by keeping those updates to build a history, since a model can only learn from what has been recorded. Figure 2 shows the pipeline we have in mind, which has four steps.
- Log. Each tracking update becomes an observation (train number, station, scheduled time, actual time, stated cause). After a few months, you have the history of every train and every segment.
- Enrich. These observations are cross-referenced with weather (temperature, snow, freezing rain), the calendar (day, departure time, season), announced track work, and the type of cause, such as congestion or mechanical failure.
- Predict. A supervised machine learning model estimates, for a given train and date, the probability of a delay longer than 30 minutes and its likely size.
- Deliver. The estimate goes to travelers at the time of booking, to operations as a dashboard of at-risk trains over the next 48 hours, and to customer service, so they can give a realistic wait time when a train is stopped.
Figure 2. The proposed pipeline for turning real-time tracking data into delay predictions.
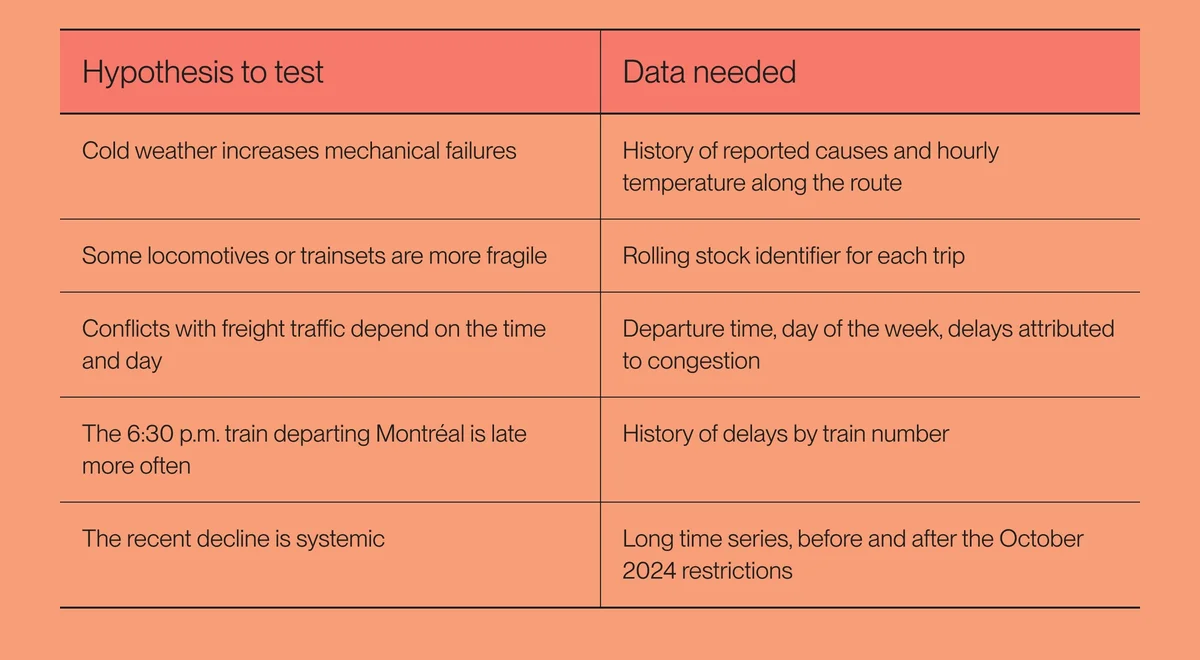
The starting model doesn't need to be complex to be useful. A simple first model, such as a logistic regression trained on a few months of history, is enough to set a baseline and then measure what each new data source adds. Table 3 links the theories that circulate about delays to the data that would let us test them..
Table 3. Common hypotheses about delays and the data needed to test them
Limitations and conditions of validity
This personal analysis rests on my 30 trips between Montreal and Quebec City, and it counts only delays that earned a full refund. The alert emails I received for delays of 15 to 30 minutes were kept but not used. They would make it possible to move from a simple alert to an estimated delay duration. The probability calculation also assumes that trips are independent, which isn't entirely true: speed restrictions, for example, affect several consecutive trips.
The predictive system is still just an idea. To make it reliable, the causes recorded in the data would need to be accurate: if the reasons for problems are logged poorly, the model will learn poorly. And because the network is changing right now, a model trained today would learn a situation that won't last. It will need to be retrained once things have stabilized.
What we take away
- The history is the baseline. Comparing the recent period with the one before it makes a change measurable, whereas an overall rate calculated across the whole period masks it.
- A window chosen after the fact overstates the surprise. The same result goes from about 1% to about 9% probability depending on whether the window is set before or after looking at the data.
- An independent source strengthens a small sample. VIA Rail's public data gave the diagnosis support that a few more trips wouldn't have.
- A decision combines probability and impact. When the likelihood of an incident is out of our hands, reducing its impact is still an option.
The same reasoning applies when a client tells us an AI system “isn't working anymore.” Before changing models, we compare its recent performance with the previous six months, check whether the drop is across the board or concentrated in one segment, and look for what changed in the data or in the nature of the requests. The fix is often more targeted than a rebuild, whether that's a business rule for a problematic data type or a dedicated subsystem for an edge case, while the main system keeps serving everything else. This kind of diagnosis requires accepting some uncertainty, because a small number of observations rarely settles the question. The open question, for VIA Rail as for these systems, is when a degradation stops being a transition and becomes the new normal.
Is something degrading in your data or your models? Book a call